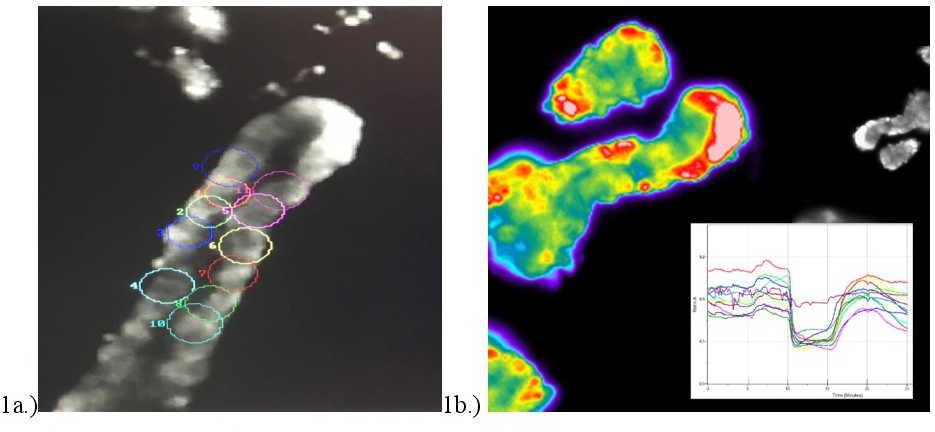
Fig. 1. 1a.) Sample rat colonic crypt with selected regions of interest (ROI) to monitor intracellular pH. 1b.) Pseudocolor image of colonic crypts with filter to visualize local pH values based on fluorescence intensities. Lower right corner is a tracing of multiple cells during and following an NH4Cl prepulse. The red values are the more basic pH values, and the green values are the more acidic.